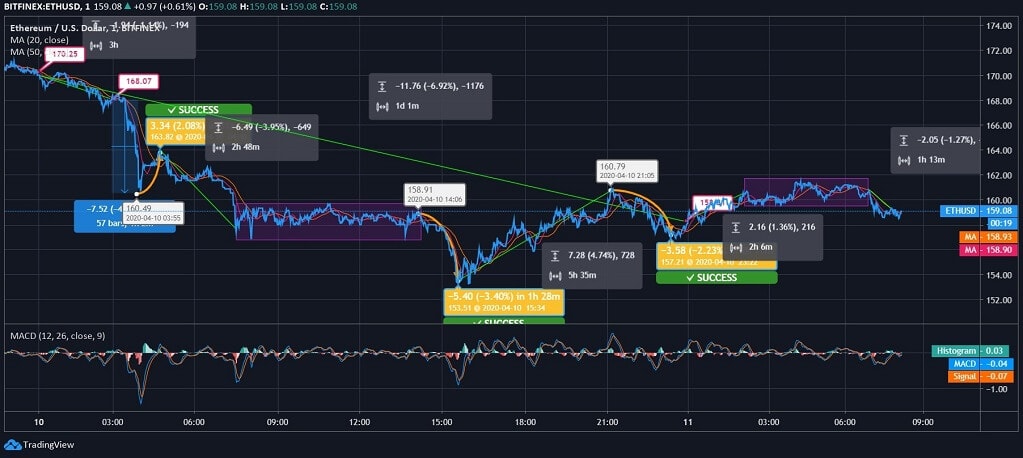
Ethereum price movement is reflecting a slight improvement in the momentum. The coin is now trading at $159 after having dipped at $153 yesterday. The recovery in the ETH coin has already started, and in the upcoming hours, its immediate resistance level at $167 would be seen violating. Once the resistance is crossed, then the upcoming days could be better for the traders.
Ethereum Price Analysis
Ethereum price chart is exhibiting a heavy change in the price. The coin started dealing at $170 at 00:00 UTC, and in the next 3 hours, it touched $168. Then, there was a sudden steep plunge observed that brought the ETH price to $160 at 03:55 UTC. After this steep fall, the price improved to $163 by 2.08% hike, but couldn’t hold itself for long and dropped to $157 by 3.95%.
Later, the price locked around the same level till 14:06 UTC, and then, Ethereum price plunged to $153 by 3.40% fall at 15:34 UTC. The currency closed the day at $159 price mark with an intraday regression of 6.92%. Today, ETH coin started trading with an improvement. The price counters moved from $158 to $160 by 1.36% hike. Then, the coin locked its price around the same level till 06:55 UTC. Recently, the price slipped marginally to $159.
Technical Indicators
The 20-day MA and 50-day MA of Ethereum are at $158.90 & $158.93, respectively. Both the moving averages are below the current price. The same indicates that the ETH price might reflect a recovery in the impending hours, and the traders might be seen the anticipated resistance breach.
The MACD indicator shows that the MACD line just crossed the Signal line and formed a bullish crossover.
As per the current momentum, the chances of escalating to the immediate resistance level at $167 are relatively more than slipping to the immediate support level at $151.


